Current research activities
In the summer of 2023, a large-scale research project began on the Swift River to study the wild brook trout population. Antenna arrays have been installed at several locations along the Swift. Biologists are marking brook trout with individually numbered internal tags that can be read by the in-stream antennas or manually by researchers in the field. Tagged brook trout are safe to eat—the internal tag can be easily removed when cleaning the fish.
To get details about the research design and goals, click the link below.
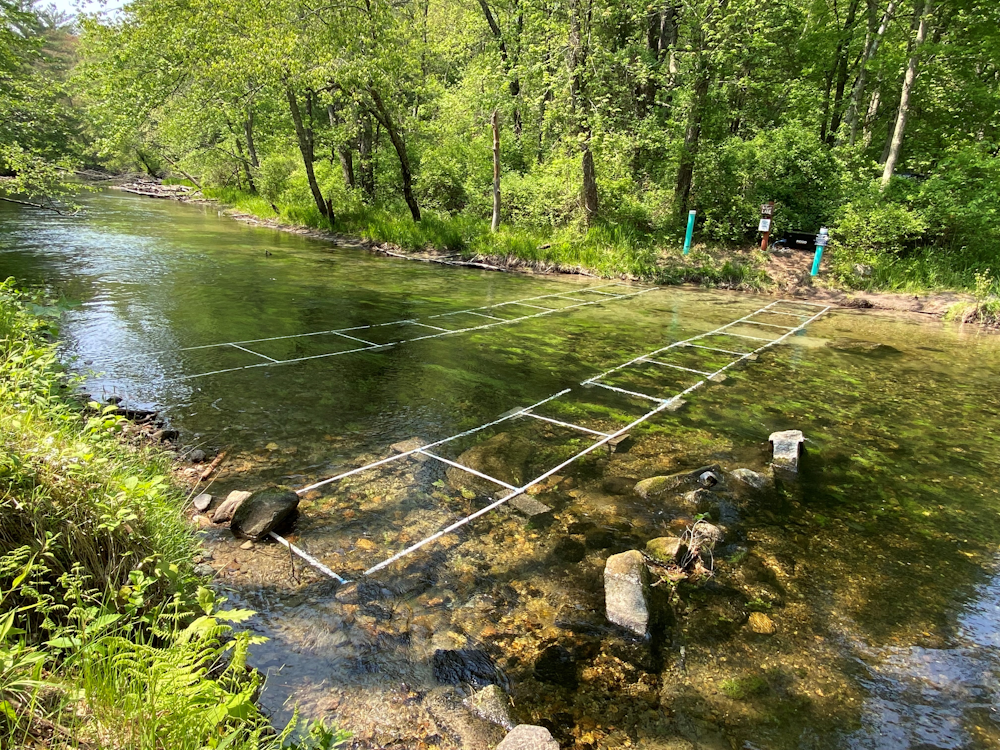
Several antenna stations have been installed along the Swift River. The antennas will continuously detect and log signals from tagged brook trout that swim by.
2021 Research and results
Mark-recapture study
After several years of observation and monitoring and a limited mark-recapture study in 2017–18, MassWildlife fisheries biologists had enough background to begin more comprehensive research on the Swift River Fishery. The first phase was to take a closer look at the fate of stocked rainbow trout and brown trout in the tailwater. Observations and angler reports suggested that the number of stocked trout in the river after stocking did not necessarily meet expectations based on the number of trout that had been stocked. While this seemed to be the case for the entire 5.5 miles of the tailwater it was even more evident in the year-round Catch-and-Release Area upstream of Route 9. Where were all the fish going?
Methods
To answer that question, MassWildlife developed a simple mark-recapture survey methodology. All stocked trout in 2021 were marked with a small elastomer mark (a tiny permanent hardened dye, similar to a tattoo) just under the skin behind the left eye (Figure 1).
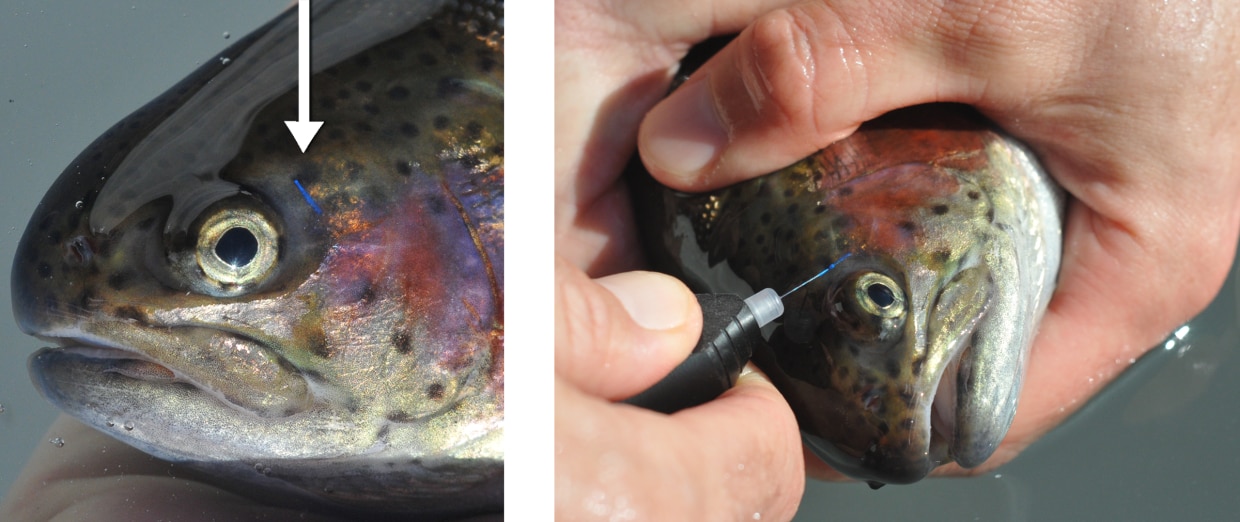
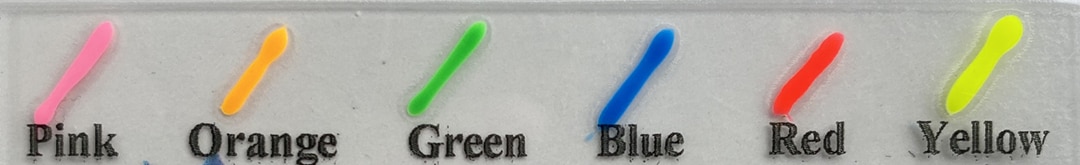
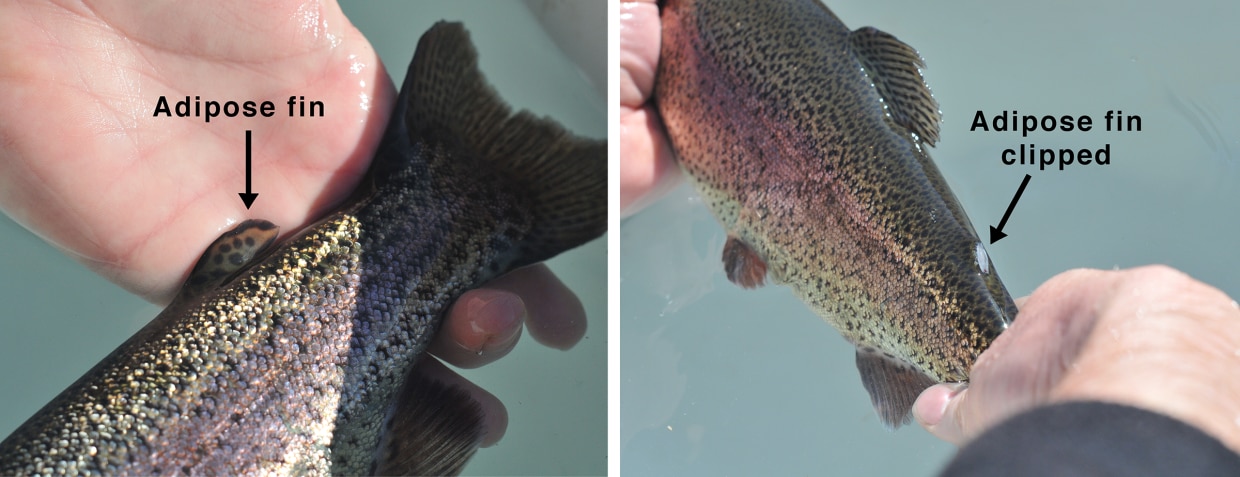
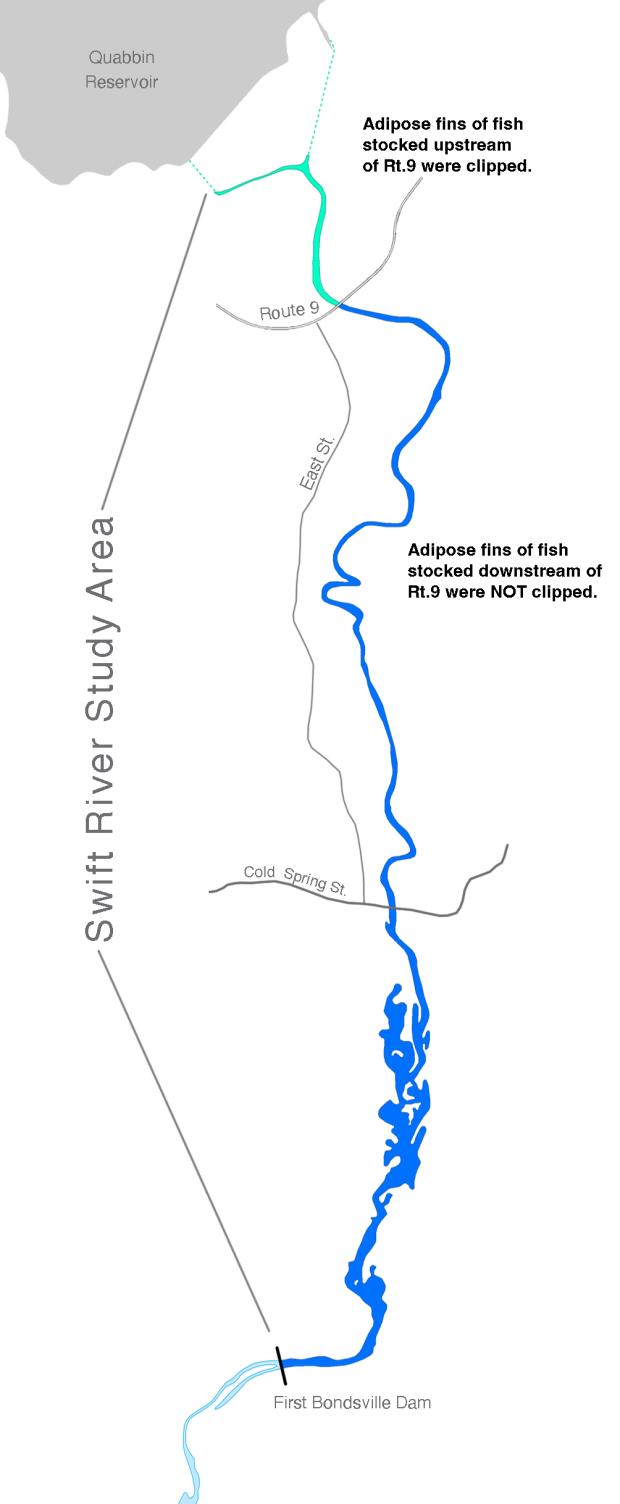
Figure 1. (Top to bottom) Elastomer mark being injected under the skin behind the left eye of a soon-to-be-stocked hatchery rainbow trout. Trout were tagged with a different color each month. Adipose fins of fish stocked upstream of Route 9 were clipped; fish stocked elsewhere were not clipped.
Each stocking cohort was marked with a different colored mark. Adipose fins of fish stocked upstream of Route 9 were clipped (the year-round catch-and-release area). This additional marking was done to monitor whether fish stocked above Route 9 were emigrating to other sections of the river.
Recapture surveys were done using a combination of raft and boat electrofishing. MassWildlife surveyed the entire tailwater from Windsor Dam downstream to near the first Bondsville Dam one week, one month, and three months post-stocking for each stocking cohort. Not all scheduled surveys lined up perfectly so the river was actually surveyed relatively frequently over the course of the study. This will be reflected in the figures. All rainbow and brown trout captured in the surveys were inspected for colored elastomer marks and adipose fin clips and released unharmed (Figure 2).
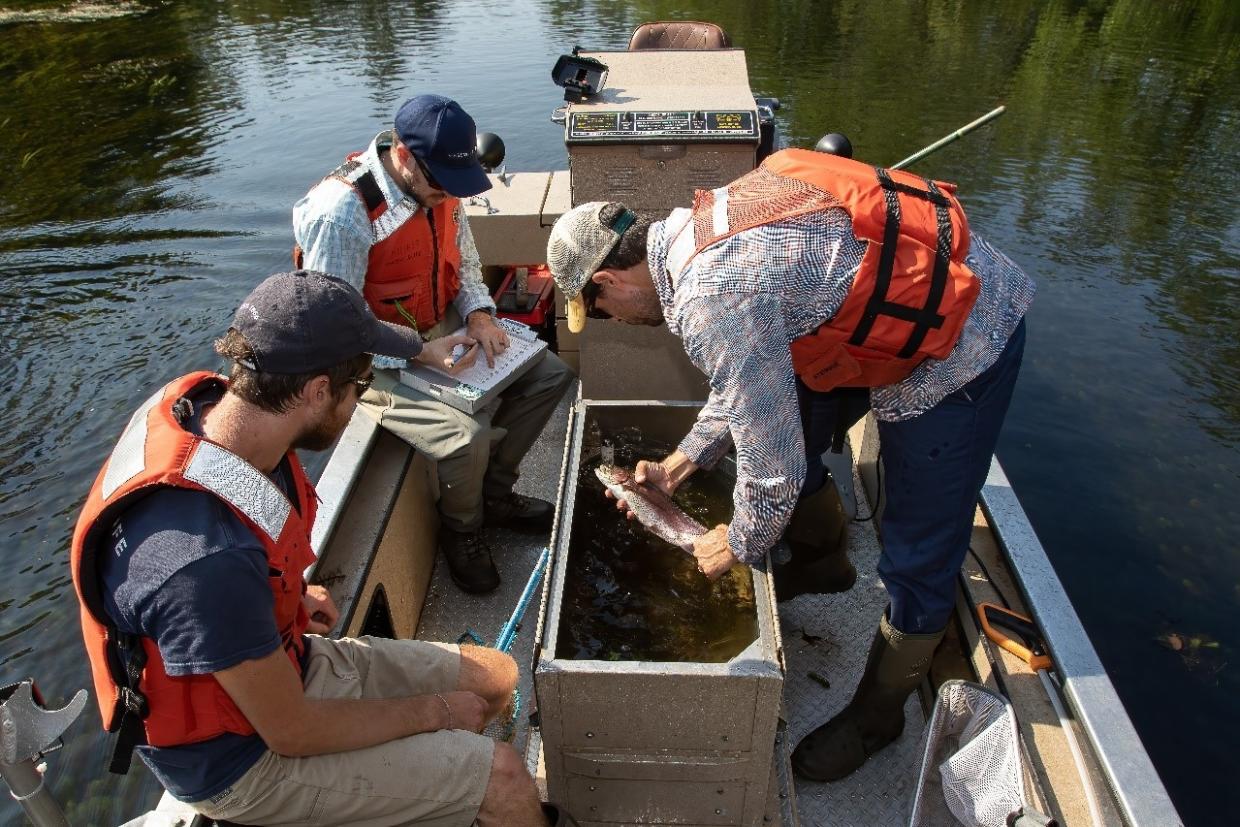
Figure 2. MassWildlife staff assess captured rainbow trout for elastomer tags and fin clips during an electrofishing recapture effort. Fish are stunned, captured, and released unharmed after their tag data is recorded.
When quantifying fish populations in the wild, it is almost never possible to capture every fish in a waterbody, so capture efficiency models are used to estimate the population. To estimate the Swift River population, MassWildlife biologists relied on a capture efficiency multiplier from a 2020 effort. In May 2020, MassWildlife stocked a batch of hatchery trout with an adipose fin clipped and returned the next day to recapture them and calculate efficiency. The average capture efficiency was 10%, meaning that one out of every 10 trout that were stocked on the previous day was recaptured. Again, quantifying fish populations is only an estimate. Capture efficiency can vary from survey to survey due to weather, water levels, and other factors. This method also assumed that trout survived and stayed in the area for 24 hours after stocking.
Study area map
Results
Trends in abundance post-stocking
Survey results clearly indicate that for all stocking cohorts, except for October rainbow trout, there is a sharp decline in trout abundance one week after stocking (Figure 3). The decline in abundance, while still obvious, is less pronounced for brown trout than for rainbow trout. Following this initial drop-off there is only a gradual decline leading to a relatively stable, level of abundance by mid-summer for all spring stocked rainbow trout (March/April/May). The summer stocked rainbow trout, although not subject to harvest except downstream of Cady Lane (due to seasonal catch & release regulations), also showed an initial large decline in abundance post-stocking. However, the summer rainbow trout were the most abundant stocking cohort and remained so throughout the summer and early fall even though their abundance continued to decline at a fairly rapid rate across this entire period. The October rainbows were an anomaly in that they appeared to increase in abundance for a month after stocking. This is of course impossible and is caused by the use of a capture efficiency multiplier (see Methods section above for details). Fall rainbows did not increase in abundance, but they did not show the rapid initial decline as seen in all of the other stocking cohorts. A decline in October-stocked rainbows was eventually observed but was delayed relative to other stocking cohorts. The delayed decrease in abundance may be attributed to one or several factors including higher capture efficiency, reduced fishing pressure during the fall season, or characteristics unique to the particular strain of rainbow trout that are stocked in the fall.
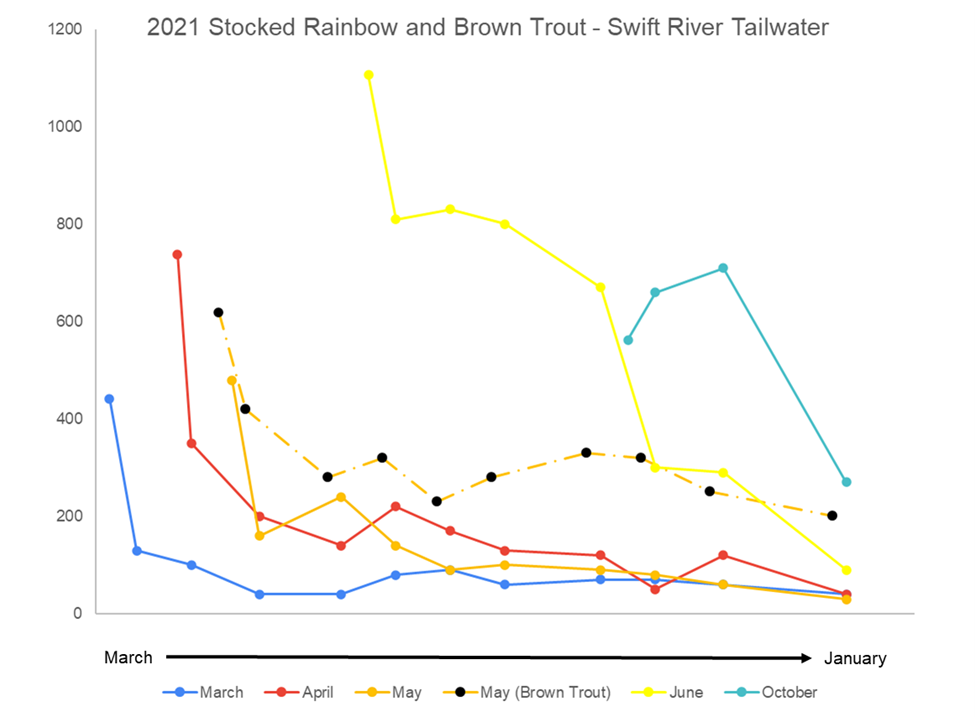
Figure 3. Estimated abundances of different cohorts of stocked rainbow trout and brown trout from March 2021 through January 2022. Each color represents the mark given to the unique stocking cohort from March, April, May, June, and October 2021. Only one cohort of brown trout were stocked in May 2021.
Overall, a large proportion of hatchery rainbow trout (~50%) and, to a lesser degree, brown trout (~33%), were unaccounted for one week after stocking. This trend was most pronounced in rainbow trout stocked earlier in spring. Abundance of rainbow trout stocked in summer stayed higher for longer, but by the third month after stocking their numbers had declined substantially as well. By the end of the study only 14% of 3,326 rainbow trout and 32% of the 619 brown trout stocked into the Swift River tailwater were accounted for.
The number of stocked trout in the Swift River tailwater is expected to continue to decline throughout the remainder of the winter and into spring before the population is replenished beginning in March with rainbow trout and in May with brown trout.
At this point, there’s no clear answer about what is happening to the fish. Possibilities include natural mortality (e.g., inability to survive outside of the hatchery environment, intense competition, or predation), angler harvest, catch-and-release mortality, or movement outside the study area. This study is the first step in gaining a better understanding of trout movement and survival in the Swift tailwater. Further studies, including a comprehensive creel survey to find out how many trout are harvested, are needed.
Movement patterns post-stocking
In addition to measuring abundance over time, this study recorded movements of stocked fish. For the most part, rainbow trout tended to stay put after they were stocked during spring and summer (Figure 4). Unless the initial decrease in abundance results from large-scale movement out of the system, this comes as somewhat of a surprise given the tendency of trout to travel.
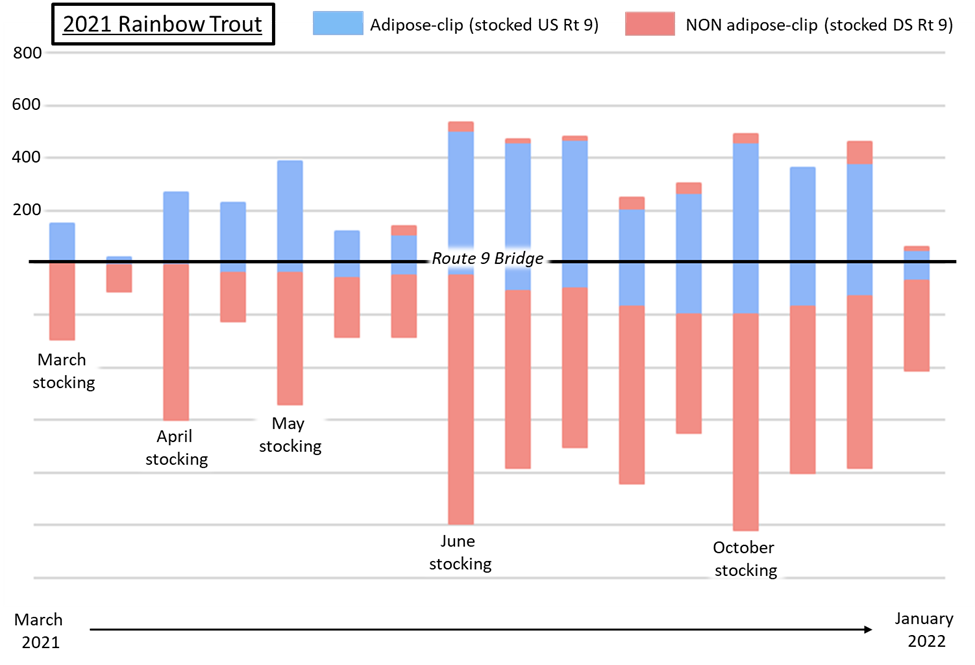
Figure 4. Capture location of hatchery rainbow trout relative to stocking location.
Studies in several upper Deerfield River tributaries during the early 2000s indicate that rainbows quickly left the locations where they were stocked and, in some cases, traveled relatively long distances before being captured. In the Swift, trout did not start ranging far from their initial stocking locations until later in summer and early fall. The Swift River tailwater differs drastically from those smaller freestone Deerfield tributaries, so it may be less beneficial for rainbows to spend the energy to move.
In the 2021 Swift River study, most rainbow trout that were recaptured outside their initial stocking locations were individuals stocked upstream of Route 9 in the year-round catch-and-release area. They were mostly found downstream, very few individuals moved in the opposite direction. While at this point, the mechanisms driving these movement patterns aren’t completely clear, it is likely the result of increasing competition for space and food. Surveys conducted in November show a slight increase in rainbows moving upstream into the catch-and-release area. This was presumably for spawning (most of the rainbow trout raised in our hatcheries are fall spawning variants).
Similar to rainbow trout, brown trout tended to stay put or move downstream from stocking locations (Figure 5). This downstream movement may have been caused by increasing competition in the catch-and-release area or simply a movement to find more suitable habitat preferred by the species (e.g., greater water depth, more cover). There were a few individuals that made the move from downstream to upstream, but there was no obvious coordinated movement of brown trout during the spring or fall.
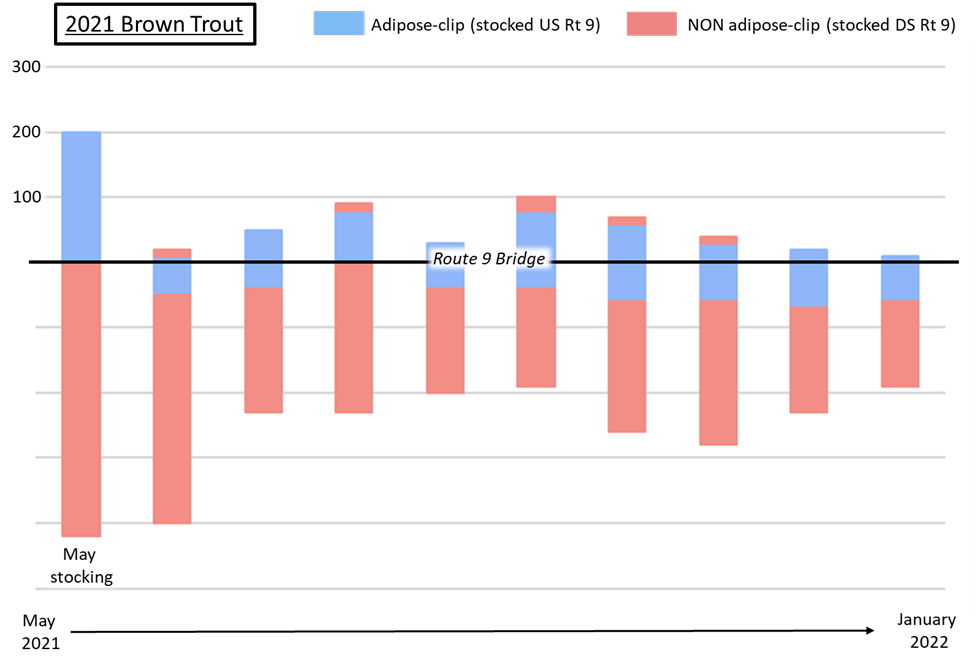
Figure 5. Capture location of hatchery brown trout relative to stocking location.
More information
Are tagged trout safe to eat? Yes. Visible Implant Elastomer (VIE) is non-hazardous. VIE tags are very small and can be easily avoided when preparing trout for the table.
Project contacts: If you have specific questions about this project, please contact Brian Keleher, Connecticut Valley District Fisheries Biologist, at brian.keleher@mass.gov or Adam Kautza, Coldwater Fisheries Project Leader, at adam.kautza@mass.gov.
The overall goals of MassWildlife are to gain a better understanding of fish and fish ecology, share the information with the public, and provide exceptional opportunities for fishing and other outdoor recreation. It’s important to note that while some hatchery trout can survive year-round in deep ponds with cold water and some coldwater streams like the Swift River, MassWildlife’s stocking program is primarily designed as a put-and-take resource for anglers to enjoy catching trout in the hundreds of lakes, ponds, rivers, and streams stocked statewide.