Outcomes made possible because of MassGIS resources
TODEX: A Transit-Oriented Development Explorer for Massachusetts
The Massachusetts Housing Partnership (MHP) works with communities to create innovative policy and financing solutions that provide affordable homes and better lives for the people of Massachusetts.
"I honestly can't say enough good things about MassGIS. Their work is fundamental to just about any spatial policy research you can imagine here in MA. Thanks for your leadership on data collection and quality. Just an amazing team!" Tom Hopper, Director of Research & Analytics MHP
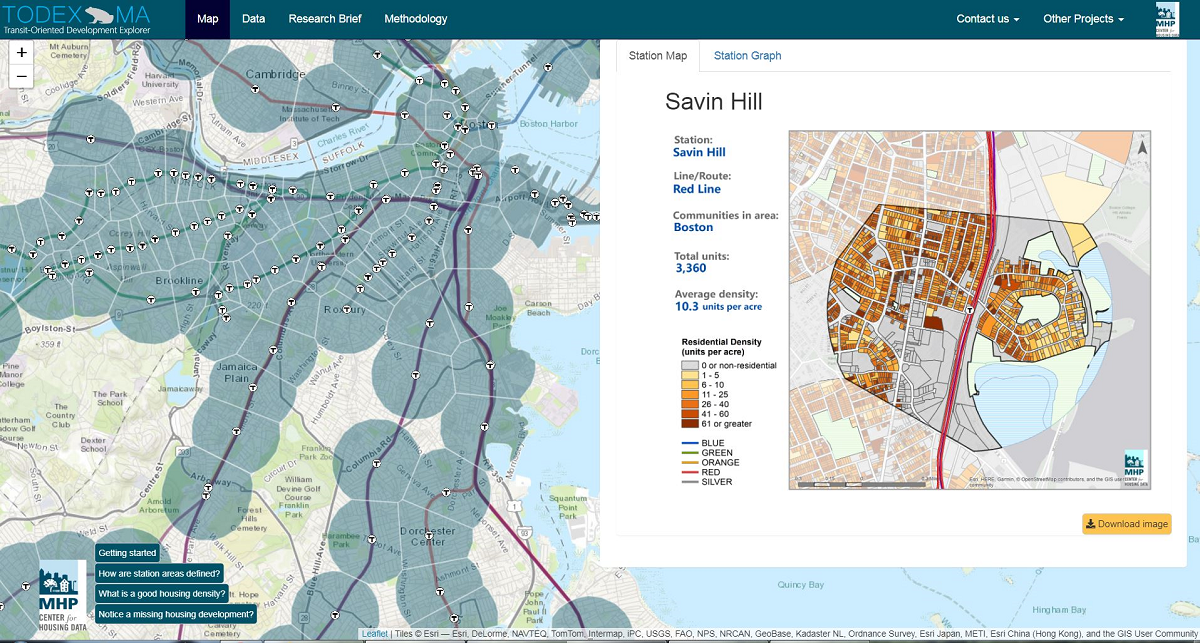
TODEX: A Transit-Oriented Development Explorer for Massachusetts is an interactive site that allows visitors to view residential density patterns around any MBTA rail station in eastern Massachusetts, compare and evaluate housing density levels across locations, and explore how low local land use decisions impact the realization of walkable, transit-accessible neighborhoods. TODEX has been used by community members, local planners and state officials to evaluate land use patterns and pursue enhanced funding and policy processes that lead to better transit-oriented development outcomes. The creation of this tool would not have been possible without the comprehensive Standardized Assessors’ Parcels and Master Address data that MassGIS collects, standardizes, and distributes, and the ability to keep the site updated and useful relies on MassGIS’ continued efforts to support and update these key data sets.
Solar Site Finding
A significant source of renewable energy in Massachusetts now comes from solar arrays. Identifying suitable locations for these arrays depends on specific geographic conditions. Resources available through MassGIS have made finding candidate sites much easier.
“Without [MassGIS's On-line mapping tool] we could not do what we do in searching for future large-scale solar sites. The tool gives us the parcel information, numerous map function, all of the information concerning a particular parcel of land, wetland factors, running water, topology information, etc.. It's all there, so at a 60,000-foot level, you can say this is a potentially good or bad solar site. …we do business in New York, Rhode Island, and New Hampshire also and these other states don't even come close to the MassGIS program we have here in Massachusetts. You have done a great job putting this program together.” Owner of a small Solar Installer, Merrimack Valley
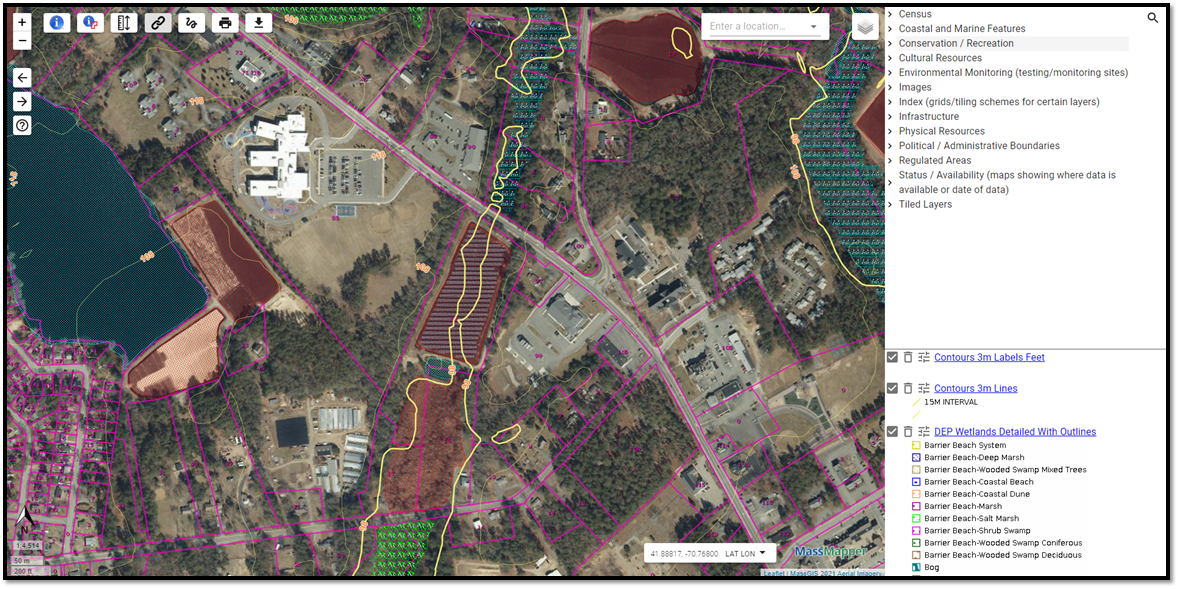
Here’s an example of the map information available through MassGIS that is important to a solar site finder. Besides the map information, MassGIS's MassMapper application includes tools for measuring distances and areas. Interact with the Solar Site Finding map
Real Estate and Development
Developing land, especially larger properties, requires reviewing a variety of geographic information as part of assessing how a property might be developed. Resources available through MassGIS make parts of this assessment easier.
“In a world of connectivity, the commercial real estate industry is behind the trend of aggregating and organizing information. MassMapper is a unique resource that offers a statewide approach for the management of information on real assets. Environmental, political, flood, terrain, ownership, and more is all overlaid on a map interface. We are weekly users of MassMapper because it saves time, connects otherwise disparate information, and, ultimately, [we] trust its sources.” Senior Vice President, Development, Major Development Company in Metrowest Boston
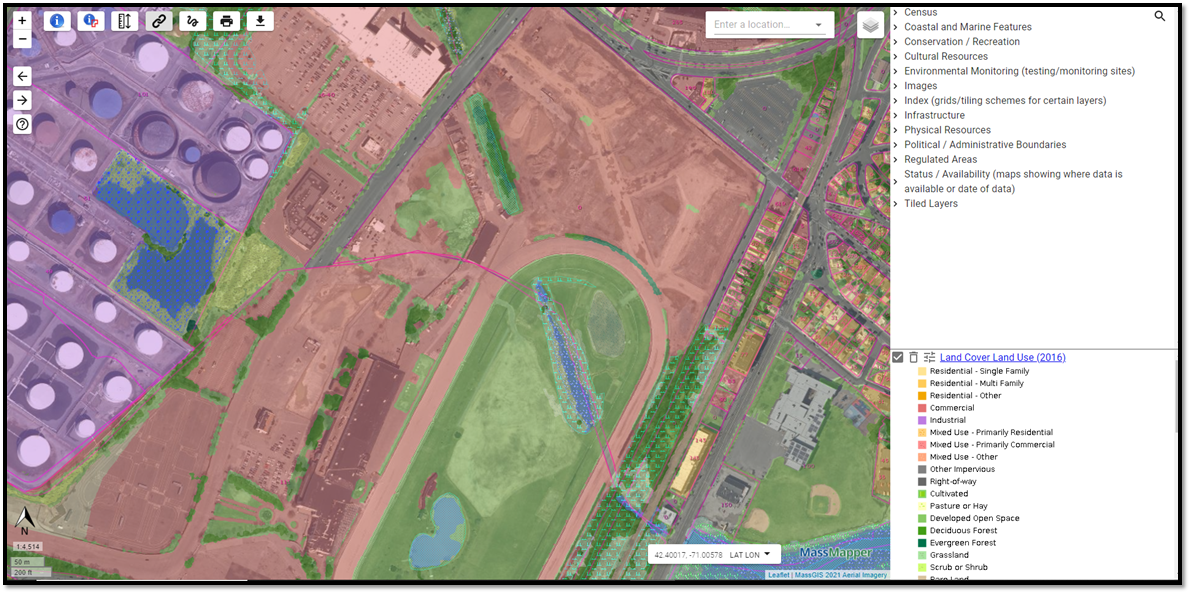
Using the Suffolk Downs property as an example, here’s the sort of map information important to a real estate developer that is available through MassGIS. Interact with this MassMapper map
Small Business Support
Many engineering, surveying, and environmental cleanup/remediation firms are small businesses. Resources available through MassGIS help these firms compete.
“Given our size, geographical location, and income flow, we don’t always have easy access to resources that larger companies in the central and eastern parts of the Commonwealth may have. Therefore, access to resources … via MassMapper enable our company to continue to exist as a small business entity.“ Owner of Engineering Firm, Pittsfield, MA
For example, an engineering firm will find this map information very useful for preliminary site assessment and project planning.

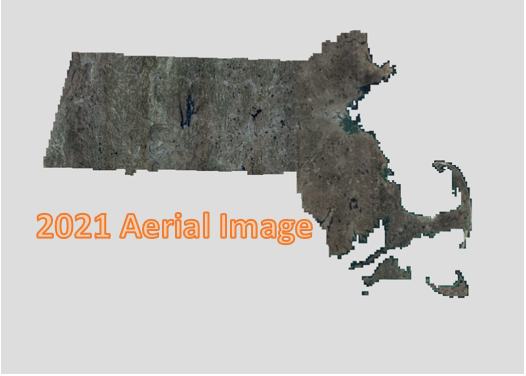
Imagery Base Mapping
Aerial imagery is the most widely used base map. As shown in the chart below, aerial imagery base maps are relied upon by a diverse constituency. In the past 20 years and at fairly regular intervals (2001, 2005, 2008/2009, 2013/2014, 2019, 2021), MassGIS has opportunistically identified and coordinated with funding partners to acquire statewide aerial imagery for use as a base map (many states have a more formally funded imagery program that follows a published refresh schedule and supports buy-ups for additional products). Review the story of the Commonwealth's image base mapping over the past 25 years.
MassGIS surveys its constituents to gauge their use of imagery available through MassGIS. Survey respondents by industry are shown in the chart below.

All vintages of the Commonwealth's imagery is available on MassGIS' website for download. We also publish all imagery as a webservice for use in web mapping applications and GIS software. Below are some results of an opt-in user survey pertaining to their use of the imagery: note that over 40% of the use is in the private sector. We know that many of these companies are small or mid-sized firms based in Massachusetts.
Who downloads our statewide data?
To better understand our customer base, we ask users to respond to several questions before they can download several of our statewide data sets.
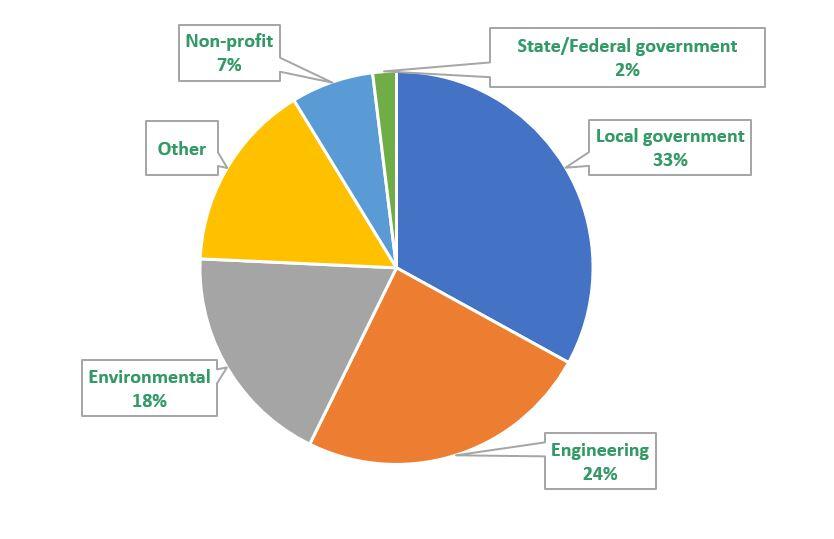
The pie chart below shows the types of organizations that are using our statewide mapping of address locations. MassGIS mapped address locations onto their building location across the Commonwealth. This very high-quality work was completed and, with municipal support, is maintained for its use in supporting 9-1-1 emergency call routing; it is the most comprehensive address database in the State and our constituents have found other valuable uses for the data. In 2021, there were about 100 discrete downloads and almost 30% of those were by state and local government and about 30% were private companies (including data services companies). Having authoritative address data available benefits Massachusetts residents by helping ensure government and private sector services are delivered correctly.

This chart illustrates the type of customers who download statewide address point data.
The Standardized Assessor Parcel mapping program has come a long way since we launched this initiative in 2010. The project’s original purpose was meeting the address data and mapping needs of the Next Generation 911 system (NG911). From that success, we moved to funding enhancements to the standardized mapping so that it met municipal needs. With these enhancements, municipalities have transitioned to maintaining standardized parcel mapping. While parcel mapping remains important for maintaining mapping used by NG911, a broad cross section of MassGIS’ constituents rely on this data. The statewide data was downloaded over 600 times in 2021. Over 40% of those downloads were by real estate, environmental services, data services, and engineering companies.

This chart illustrates the type of customers who download statewide parcel data.
Since its inception over 30 years ago, MassGIS has always been about open data. The taxpayers pay for the data development so we've always made it available. Many years ago, distribution was done mostly via paper maps ordered using paper forms mailed in with bank checks. With the advent of CDs and then DVDs, for a fee we distributed maps using that media. Now that Amazon Web Services provides us with virtually limitless storage with no file size limitations, we can readily distribute our entire statewide map database (excluding imagery, the data totals almost 6GB and 200 datalayers) via download. In 2021, over 650 users downloaded the statewide data package. Over 30% of those downloads were by real estate, environmental services, data services companies, and engineering companies.

This chart illustrates the type of customers who download map database (except imagery).
In addition to the 3 statewide datasets above, users can download any of the 100's of individual datasets from our data download page, or can package and download smaller sections of data using our interactive online map, MassMapper.
Who accesses our online mapping tools, and how often?
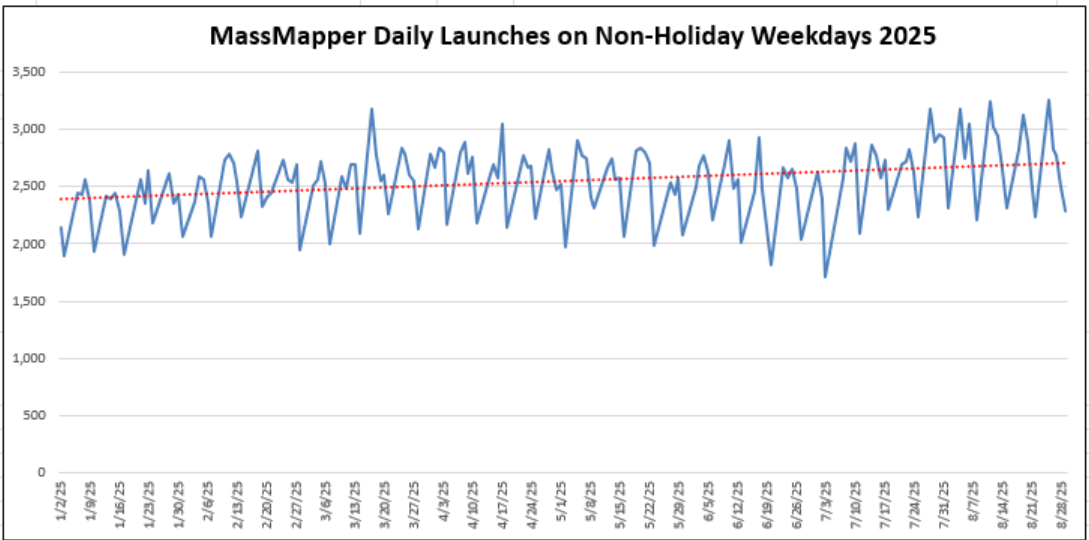
MassGIS' MassMapper is is MassGIS's flagship interactive map to be used in a web browser. Use MassMapper to access virtually all MassGIS map layers and to view descriptive information about the features on the map. Users can quickly create and share maps and download data for use in a Geographic Information System (GIS) or export tabular data as Excel or CSV files.
MassMapper has been launched an average of 2,100 times/day (all days) in 2025. Below is a chart showing usage on non-holiday weekdays:
Before creating MassMapper, so that we could determine who uses OLIVER and the value that it has to them, we surveyed users via a link placed on the OLIVER interface. Over 40% of the survey responses were from private sector users.
Statewide Assessor Parcel Map Viewer
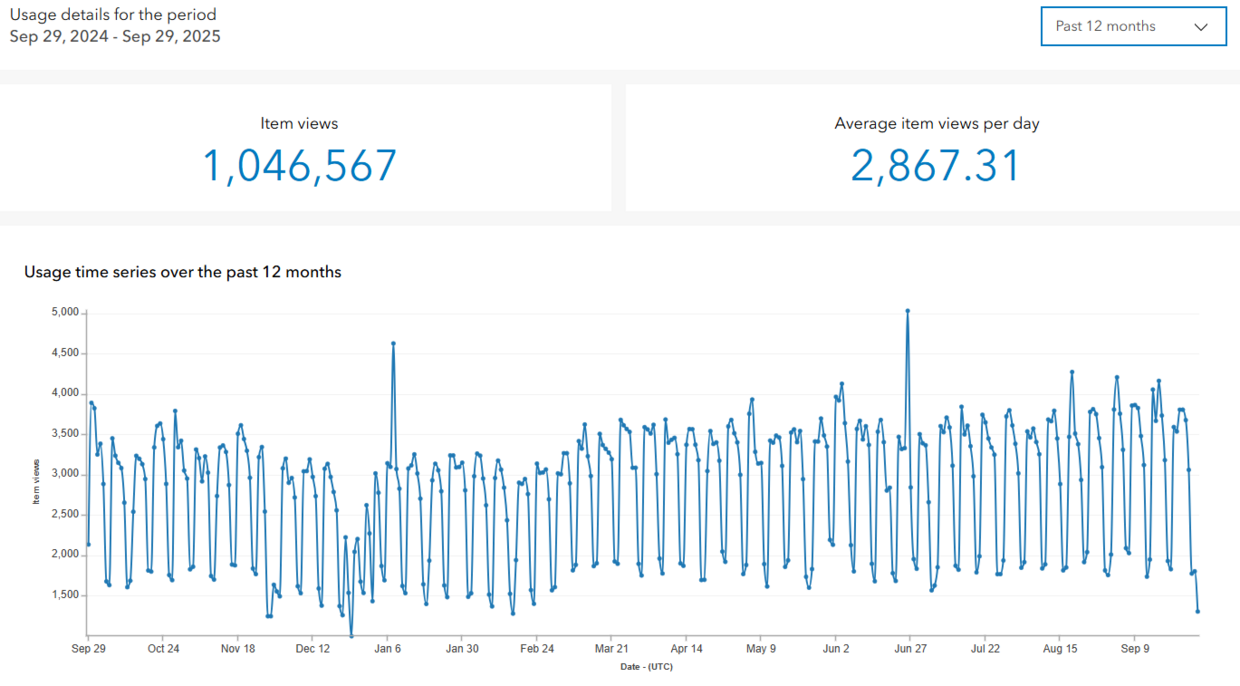
We've been making topic specific online maps using ArcGIS Online. By far our most popular ArcGIS Online map is the Massachusetts Interactive Property Map, which combines Standardized Assessors' Parcel data from 351 cities and towns into a single seamless statewide map to view the property record of any parcel across the state.
The graph below illustrates just how popular this tool is, averaging 2,867 launches per day over a one year period in from October 2024 through September 2025.
MassGIS in Action - Impactful Projects
GIS is a powerful tool for analysis. Over its long history, MassGIS has completed a variety of analysis projects for various agencies. These projects -- some highlighted below -- have often supported significant legislative or policy initiatives.
State Oversight of Housing Assistance (SOHA) Data Warehouse
Purpose: Geocoding service of housing units
When: 2022-present
Partners: Department of Housing and Community Development (DHCD)
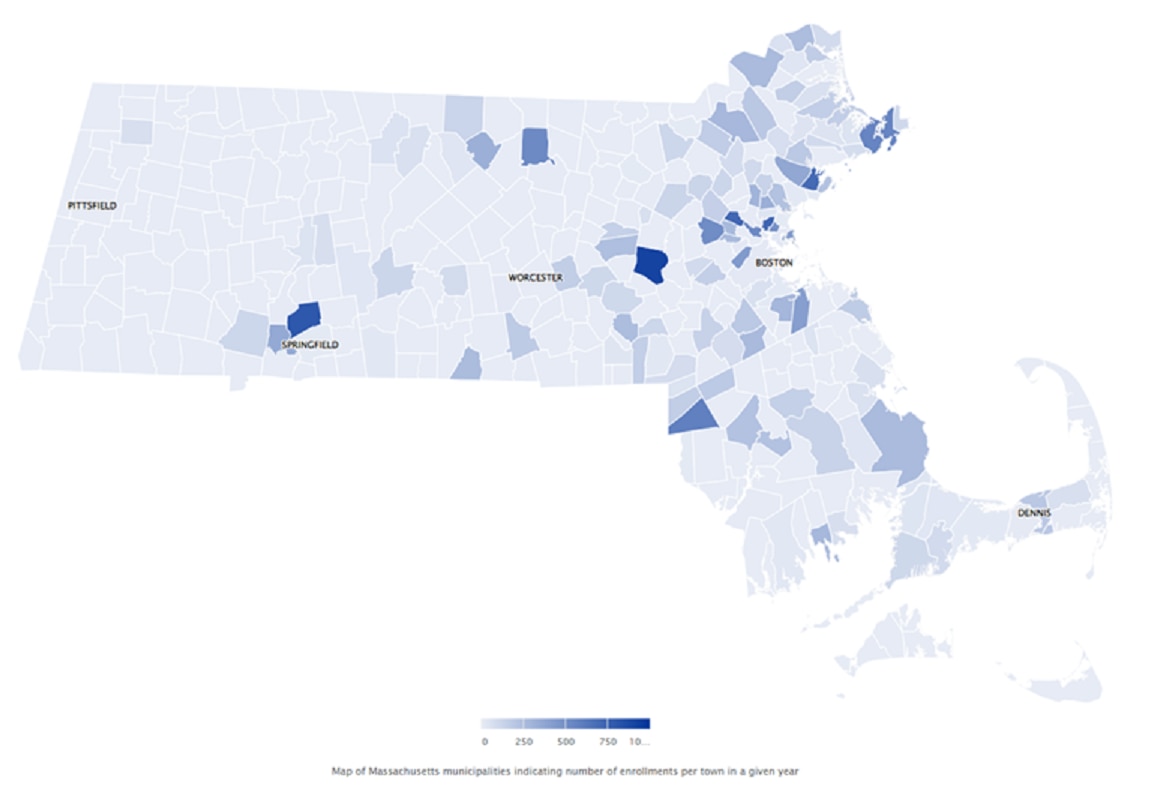
The State Oversight of Housing Assistance (SOHA) Data Warehouse centralizes tenant-level data from state-funded rental assistance programs (MRVP and AHVP) and state-funded public housing programs. The data warehouse provides accurate and readily available information to DHCD, enabling data-driven decisions about programs, policy, spending, and more. A crucial function of the data warehouse is normalizing the addresses DHCD receives from housing authorities. MassGIS provided this service quickly and effectively – along with several other important data fields – which enabled spatial analysis of housing programs stored in SOHA.
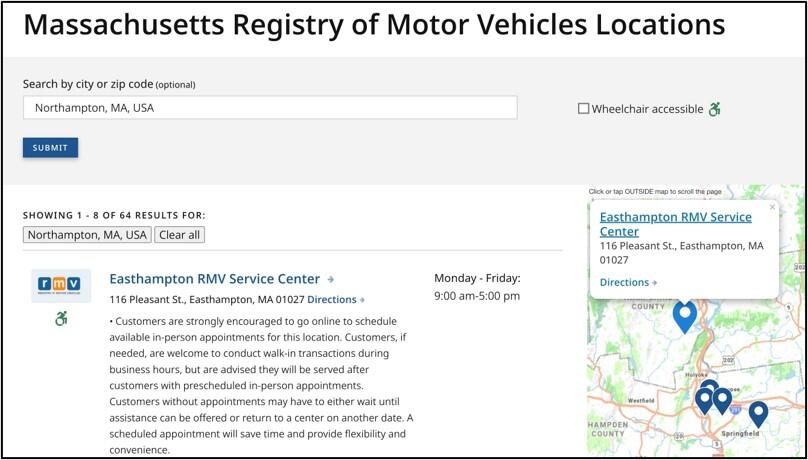
MassDOT RMV Service
Purpose: Help people find the nearest RMV office
When: 2019-present
Partners: MassDOT Registry of Motor Vehicles
The RMV uses the MassDOT GIS system 20,000 times on an average weekday. Many of these uses are searches from the RMV’s public website which helps people locate the RMV office nearest to them based on an address, town, or zip code. After the request is sent, about three million address points are searched until one is verified so the nearest RMV office locations can be shown on an interactive map on the RMV website. As the MassDOT GIS system is constantly updated so that deprecated addresses are deleted and new buildings and new units in multi-unit buildings are added to the system (using MassGIS data), residents can take advantage of this locator. MassGIS data is also used by the RMV to verify the location of where vehicles are garaged in the state.
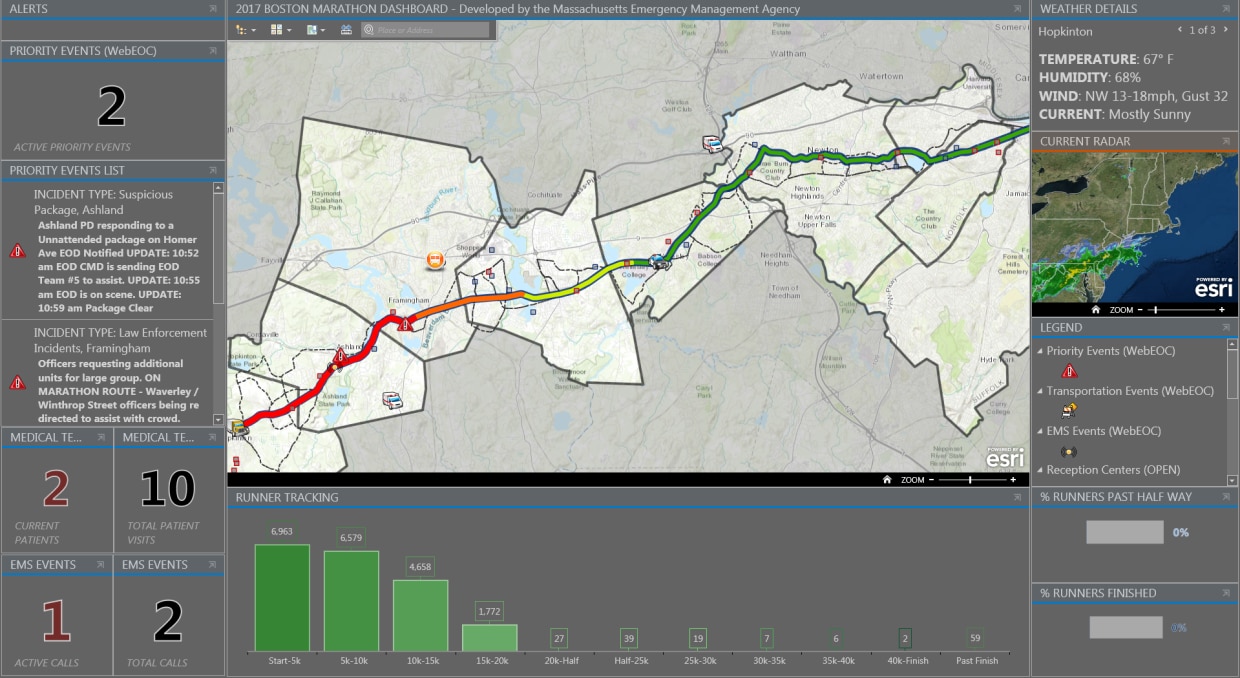
Boston Marathon Situational Awareness
Purpose: To assist the Massachusetts Emergency Management Agency with tracking the runners along the route of the 26.3 mile Boston Marathon
When: 2016-Ongoing
Partner: Massachusetts Emergency Management Agency (MEMA)
In 2016, using a data service feed of runner locations provided procured by MEMA, MassGIS developed a runner tracking map service. This service enabled MEMA to display the aggregate location status (by segment of the racecourse) of Boston Marathon runners as they progressed down the racecourse. Using a GPS tracking chip interwoven into the sneaker laces, electronic mats at each mile marker can sense the runner ID from the chip and send that information to the tracking map application. Having this information available is crucial to help with the deployment of emergency medical and safety personnel as they monitor the health and safety of the runners and spectators.
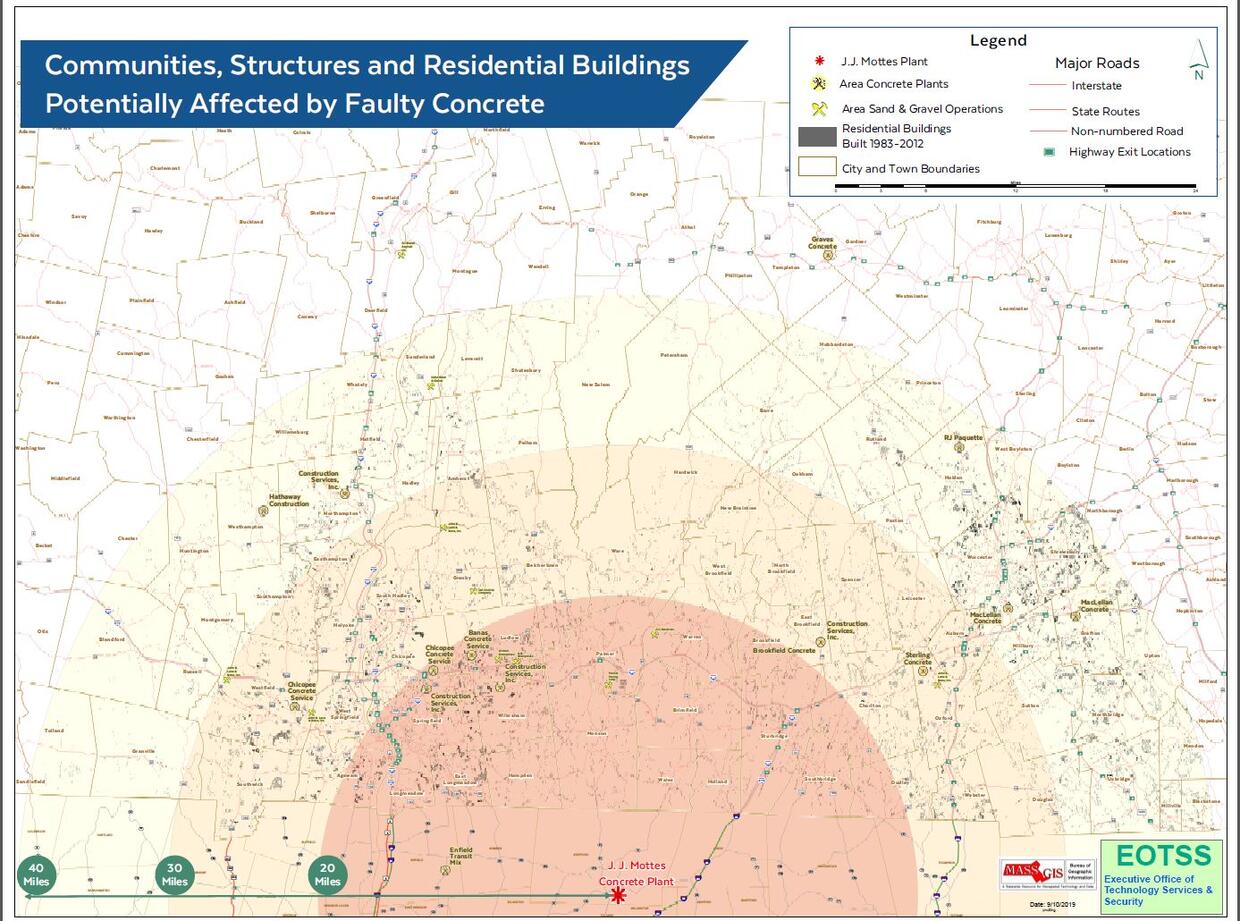
Crumbling Concrete Commission Mapping Project
Purpose: To assist the Legislature's Crumbling Concrete Commission realize the potential scope of a serious issue affecting hundreds of property owners
When: 2019
Partners: Massachusetts Legislature
In 2018, the Massachusetts Legislature formed the Crumbling Foundation Commission to study the financial and economic impacts of crumbling concrete foundations due to the presence of pyrrhotite. Between 1983 and 2012 a concrete plant in north central Connecticut used pyrrhotite as aggregate in their concrete, which, when exposed to water and oxygen, causes the slow deterioration of the building foundations. Tens of thousands of homes in Connecticut are affected, as are an undetermined number of homes in central and western Massachusetts. In 2019, MassGIS was asked by the Commission to create a map that showed the plant, all other nearby concrete plants, roads, and buildings constructed during the 29-year date range of the plant's operation. Obviously, not every foundation on those properties would contain the faulty concrete, but this project well illustrates the usefulness of having updated standardized parcel mapping data on hand for valuable analysis.
Digital Services and MassGIS Teams Analyze Rideshare Data
Purpose: To analyze the trip origins of Transportation Network Companies (Uber, Lyft and others)
When: 2018
Partners: Department of Public Utilities
On May 1, 2018, the Commonwealth became the first state to launch a website containing data about rideshare companies. Informed by data supplied by the Department of Public Utilities, MassGIS staff worked with colleagues in the EOTSS Digital Services group to create maps and other content for the web page. Informative maps were created using both React-d3 (see graphic below) and ArcGIS On-Line. While rideshare use is, not surprisingly, concentrated in more urban areas, use is both much heavier (65 million rides statewide in 2017) and much more widespread than expected.

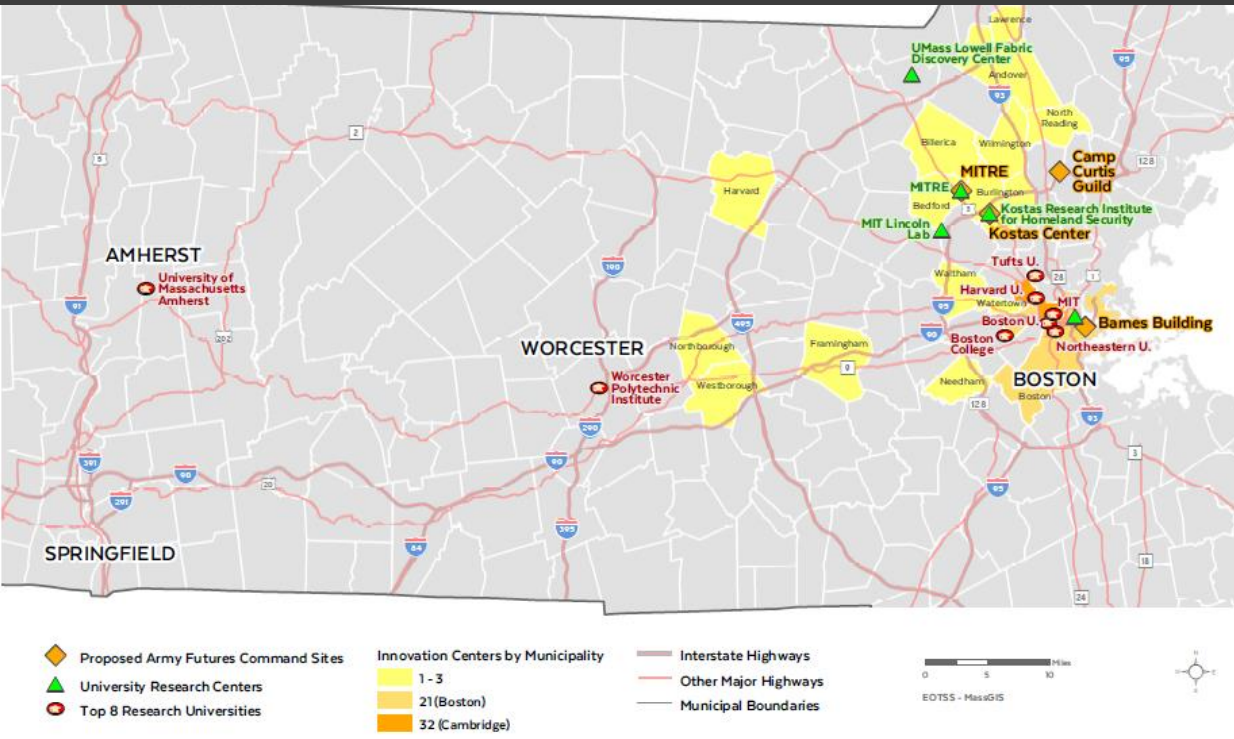
Army Futures Command Center
Purpose: To help the Commonwealth in its bid to acquire a new Federal facility that is focused on innovation and modernization of the Army.
When: 2018
Partners: MA Military Asset and Security Strategy Task Force (MASS-TF)
Massachusetts has a long history of developing military technology: RADAR at Raytheon, uniforms and other materials at Natick Labs, and advanced technologies at places like Mitre Corporation. When combined with its current world-class innovation in materials, robotics and other technologies, Massachusetts was well positioned in 2018 to pitch the state as a location for the Department of Defense’s new Army Futures Command Center. The Center’s focus on modernization and innovation was a logical fit for Massachusetts. Landing this new complex would bring with it many new, well-paying jobs, while creating an economic boost from related technological spin-offs that would fuel private sector innovation.
On behalf of a Governor’s Office Task Force, MassGIS created a series of seven maps included in the state’s compelling case for why this facility should come to Massachusetts. The maps highlighted cutting edge innovation centers, our multi-modal transportation network, and the many amenities that make living in Massachusetts desirable.
While Massachusetts was a finalist in the selection process, the DOD ultimately selected Austin, TX. Nonetheless, this project demonstrated MassGIS’ capabilities for using the power of GIS to quickly produce meaningful supporting maps and analysis.
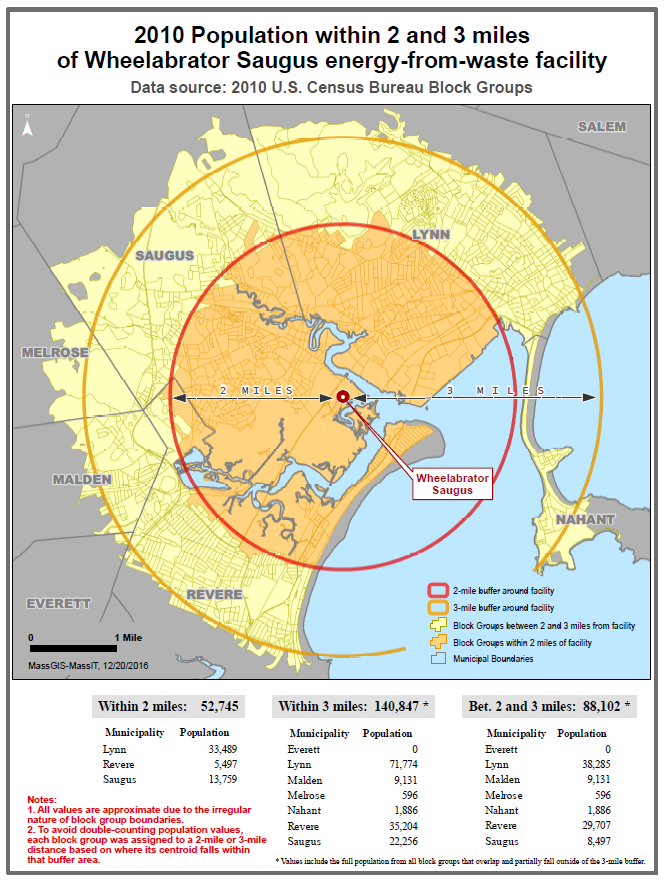
Population Estimates Proximate to Waste to Energy Incinerator
Purpose: Provide Legislators with population estimates
When: 2016
Partners: Massachusetts State Legislature
At the request of several Members of the Massachusetts State Legislature, MassGIS produced a map showing US Census 2010 population estimates at various distances from a waste to energy incinerator located in Saugus, Mass.
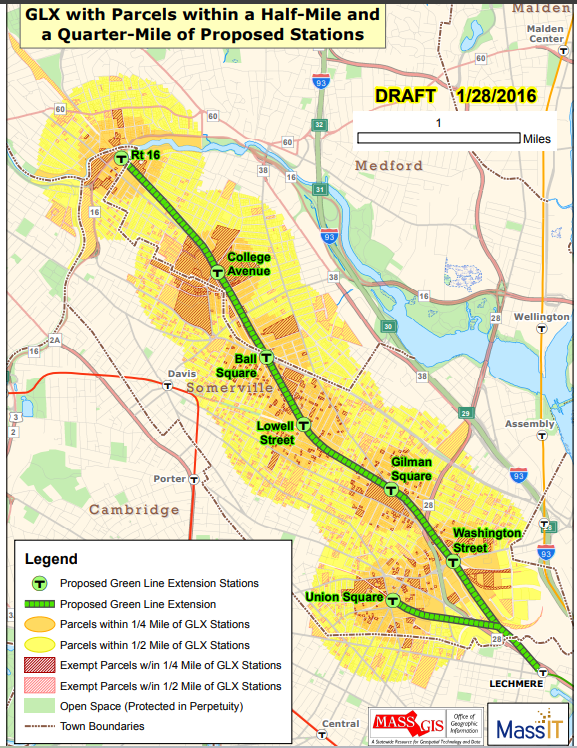
Value Capture Analysis Proof of Concept
Purpose: To illustrate land parcels in four communities that might be subject to Value Capture to help fund the expansion
When: 2016
Partners: Massachusetts Bay Transportation Authority (MBTA) and the Executive Office of Administration and Finance
Value Capture is an approach to funding public infrastructure. Public infrastructure can increase property values near the infrastructure, to the benefit of the property owners. If that increase can be estimated before the project impacts property values, then the projected value increase can be taxed as a way of funding the infrastructure. This strategy was being considered to help fund the extension of the MBTA’s Green Line northward of its current terminus in Cambridge. MassGIS used current assessor parcel data and buffer areas around the proposed stations to tally current property values. Prior year property values were used to project future valuations.
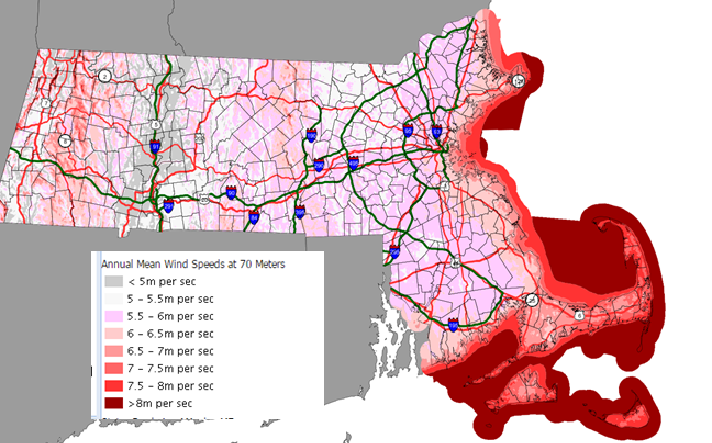
Wind Turbine Site Suitability
Purpose: Create a tool for locating sites for new wind turbines
When: 1999-2004
Partners: Department of Energy Resources
The most critical input needed for siting turbines is a map of where the strongest and steadiest winds are. In 2002/2003, Truewind Solutions, LLC produced maps and data displaying mean sustained wind speeds across New England. MassGIS created an online map showing wind speeds at various altitudes.
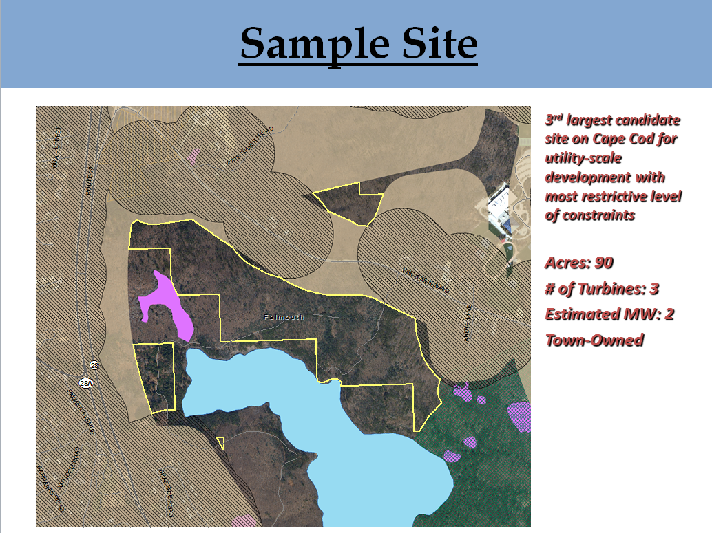
Subsequent work with parcel data and other inputs made it possible to make very specific siting recommendations by screening for setbacks and other site-specific constraints. The image below shows the results of an analysis performed to identify potential wind turbine sites on Cape Cod.
Broadband Mapping Project
Purpose: To help provide high speed Internet service to under served areas
Time: 2009-2014
Partners: Massachusetts Broadband Institute
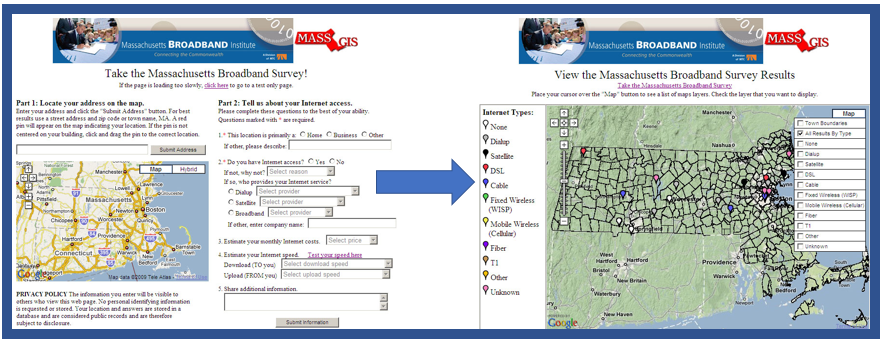
In 2008, the Governor Patrick administration signed the Broadband Act, which sought to bring high-speed Internet access to underserved areas of the Commonwealth. One of the first priorities was gaining a better understanding of service territories and gaps in broadband service. MassGIS created maps of existing infrastructure, and also created an online map using the Google Maps platform and a linked data entry form that prompted users to enter their address, and then answer questions about Internet service providers and speeds at their address.
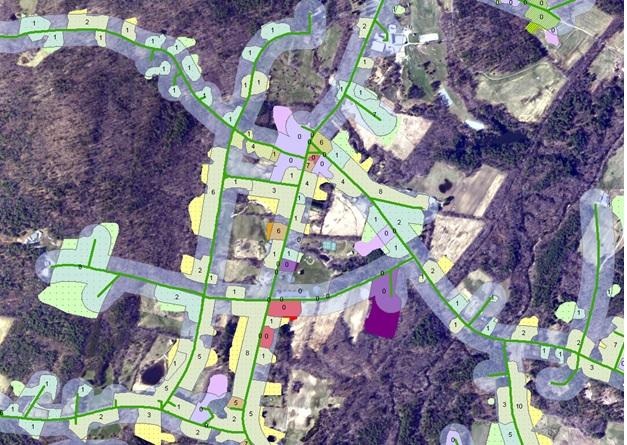
Additionally, MassGIS created several demonstration projects to help illustrate where the concentrations of potential subscribers live by using census data and residential land use data.
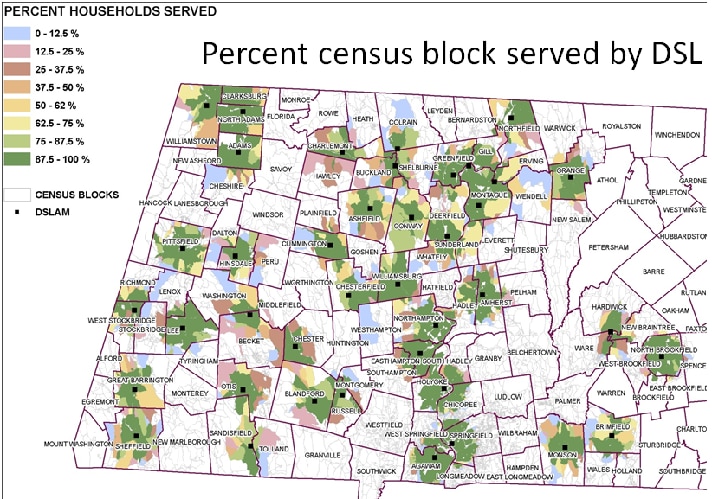
Finally, MassGIS created custom mapping to help illustrate priorities for broadband infrastructure development and its potential economic viability using census data and residential land use data along with existing infrastructure.
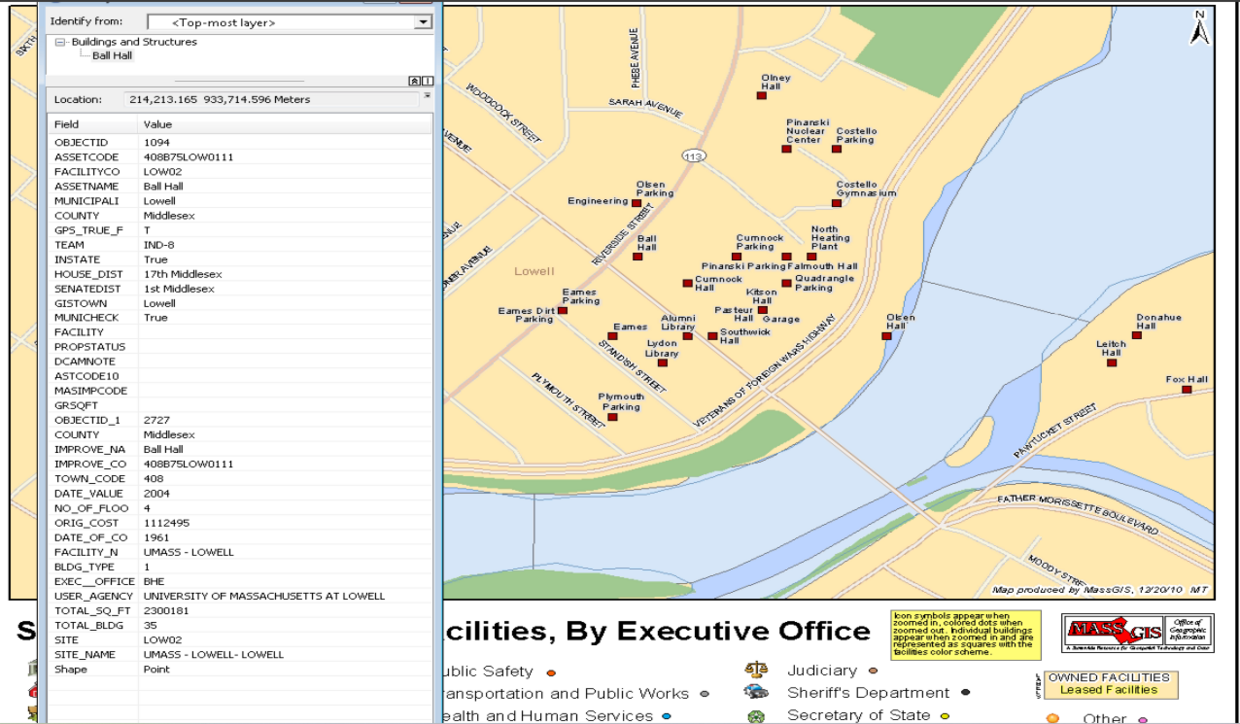
Co-location Study
Purpose: Combine State offices into underused facilities
When: 2011
Partners: Executive Office of Administration and Finance and Division of Capital Asset Management
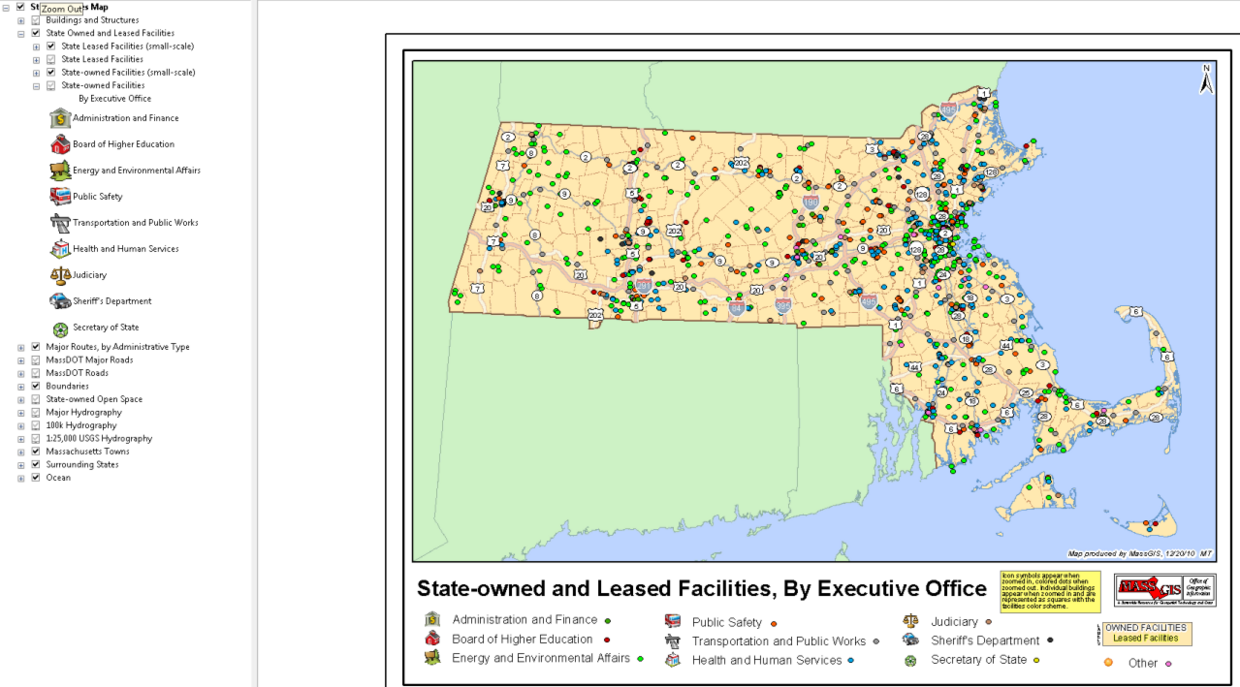
A major cost-saving initiative under Secretary Jay Gonzalez prompted an analysis of the geographic distribution of state facilities and the potential for co-location of programs in different agencies at under-utilized facilities. MassGIS developed a tool for budget analysts and others to support identification of these opportunities.
Watershed Protection Act
Purpose: To protect watershed land around the Quabbin and the Wachusett reservoirs
When: Multi-year, beginning in 1988
Partners: Massachusetts Water Resources Authority, Metropolitan District Commission (now DCR), and Department of Environmental Protection
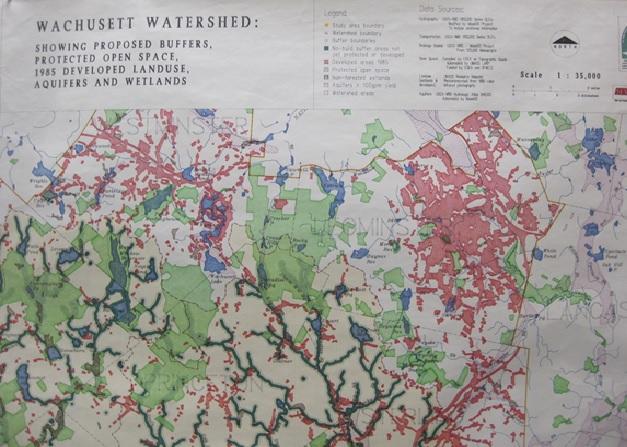
The proposed legislation strictly regulated land alterations in buffer areas around the reservoirs and their tributaries in order to maintain the high quality of the metro-area drinking water and avoid EPA-mandated construction of a hugely expensive filtration plant. The analysis was primarily to evaluate the impact of these restrictions on future development, and mitigate concerns about the effect on the local tax base. The Department of Conservation and Recreation (who oversee the protected lands in the watershed area) have replaced the paper maps with an online mapping application that MassGIS helped to create to show the areas affected by the regulations.
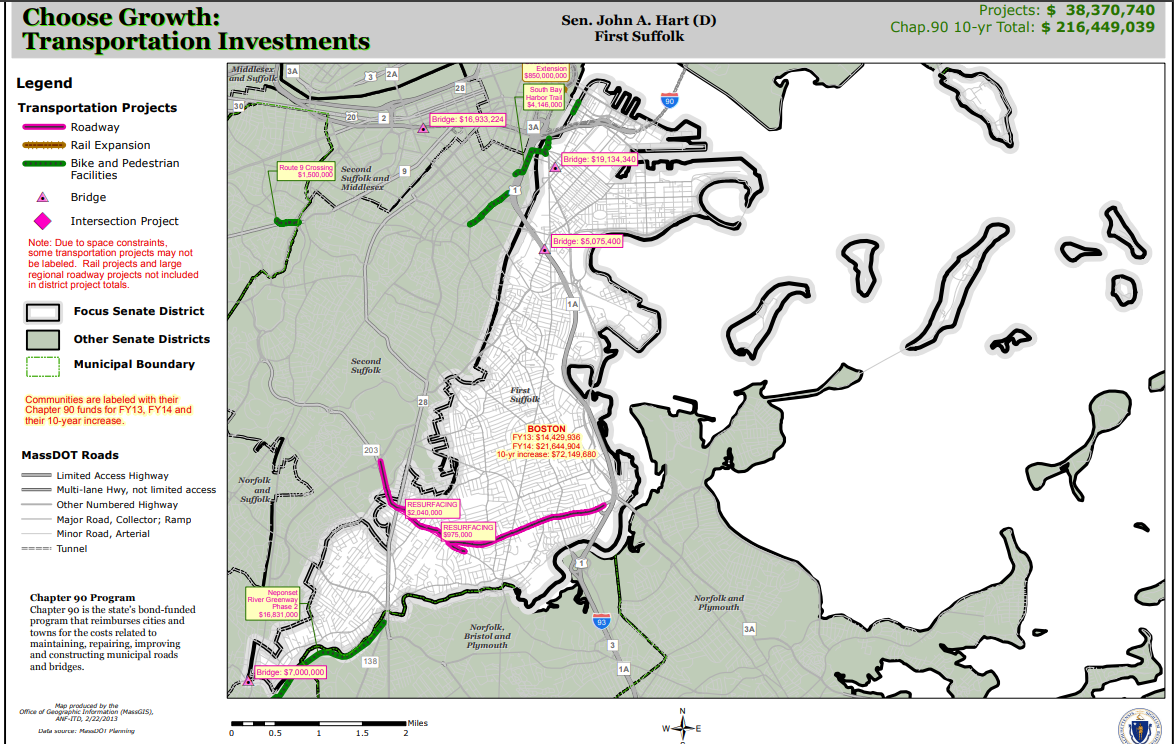
Choose Growth
Purpose: Show Legislators what projects would be funded in their districts
When: 2013
Partners: Administration and Finance, Department of Education, and Department of Transportation
One of Governor Patrick’s final initiatives was to propose to the Legislature a long-term program of investment totaling over two billion dollars in Transportation and Education. In an effort to demonstrate to each Legislator the projects that might be funded, MassGIS was tasked with creating two maps for each of the 200 Legislative districts. One map illustrated the potential Chapter 90 transportation projects, and the other showed changes to the Chapter 70 state aid to public schools and the number of wait-listed Early Education applicants. Each map included an analysis of the funding amounts that would be expended within that legislative district.

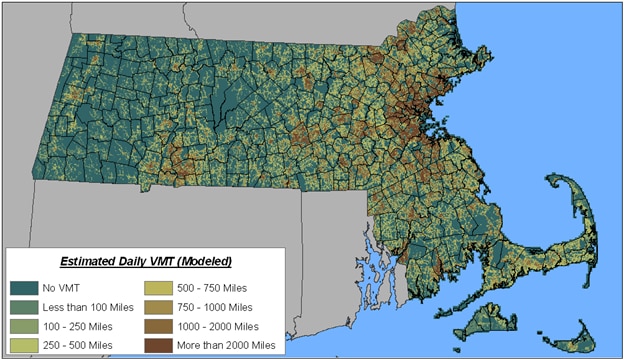
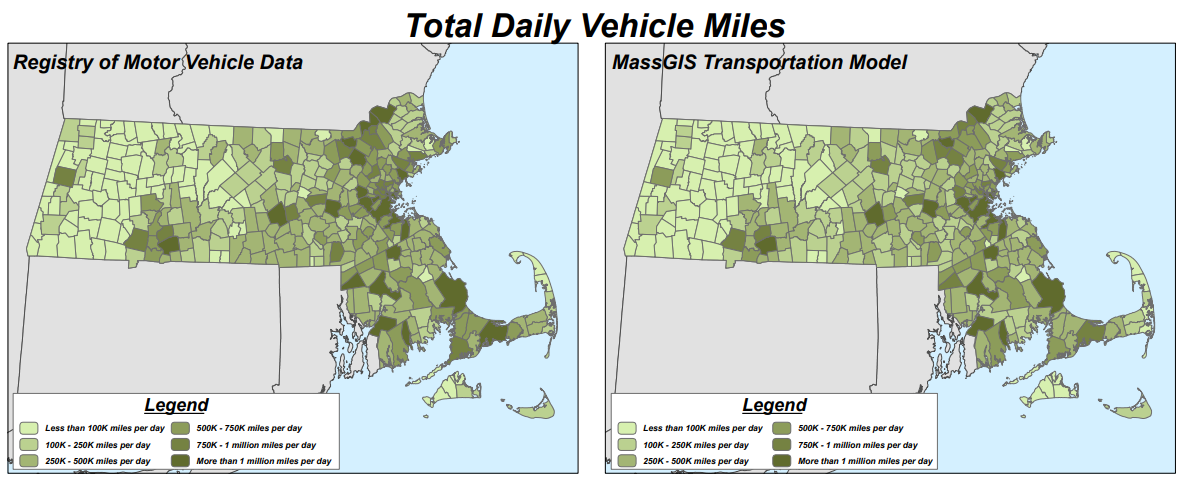
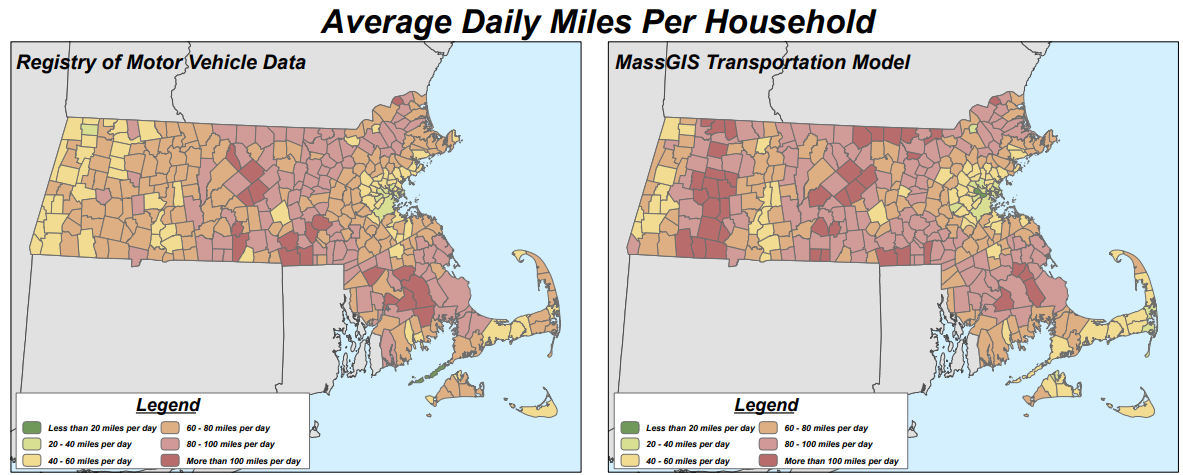
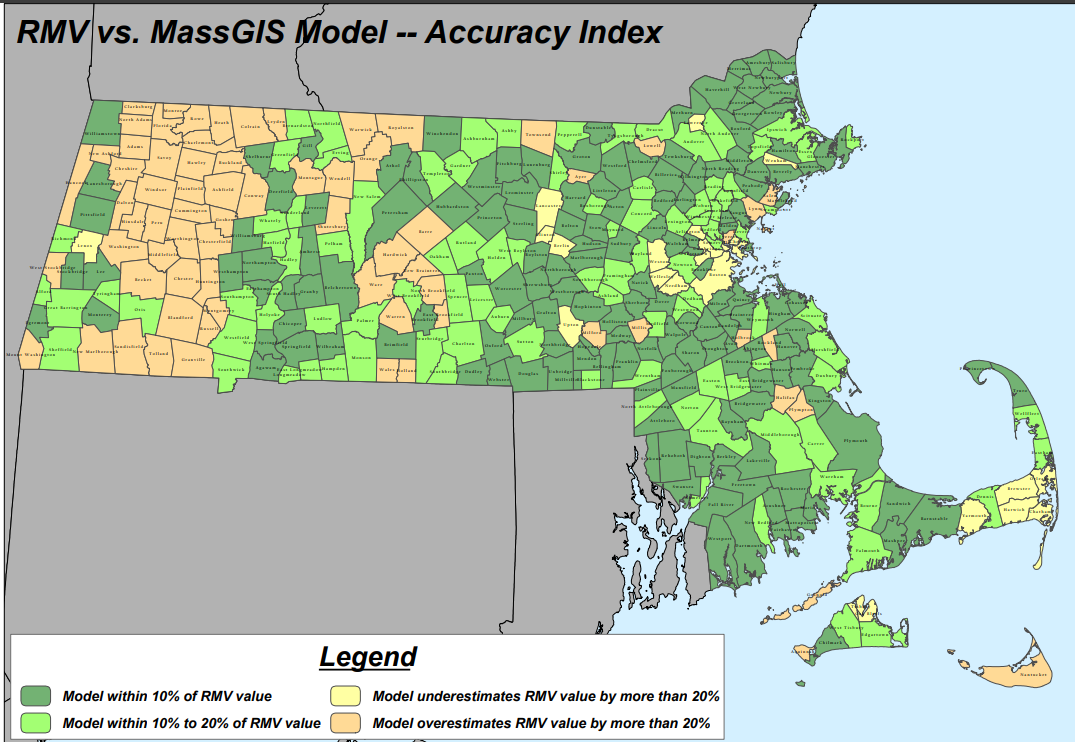
Transportation Modeling and Estimating Vehicle Miles Traveled (VMT)
Purpose: To illustrate the distribution of VMT in relation to population, transit, jobs and other factors
When: 2008
Partners: Executive Office of Energy and Environmental Affairs, Registry of Motor Vehicles
To support Smart Growth land use policies, with a long-term view towards the development of a Climate Change mitigation strategy, MassGIS produced a very detailed map of the distribution of vehicle miles driven using actual recorded odometer readings from the Registry of Motor Vehicles geocoded to their registration address. This product was then used to validate a very robust model that predicted the VMT for any given location using access to jobs, population density, transit availability and other spatially distributed factors. Neighborhood density turned out to be the best predictor of miles driven.
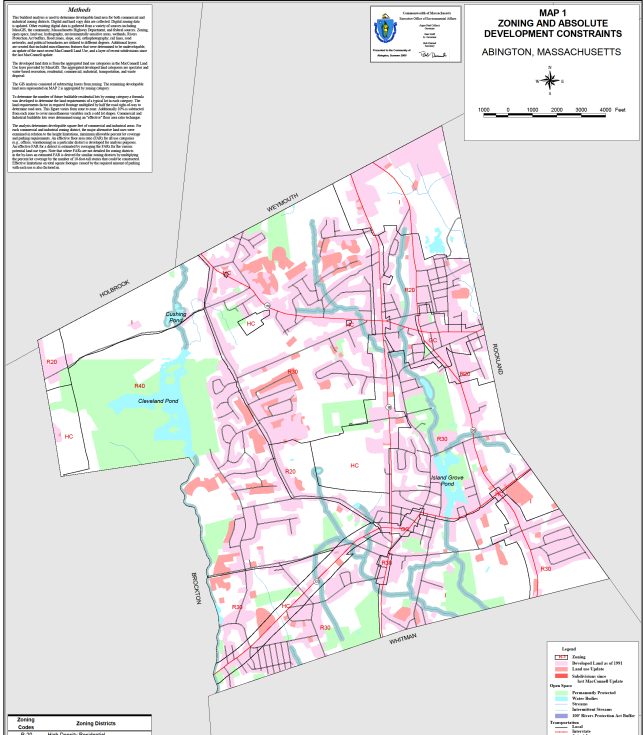
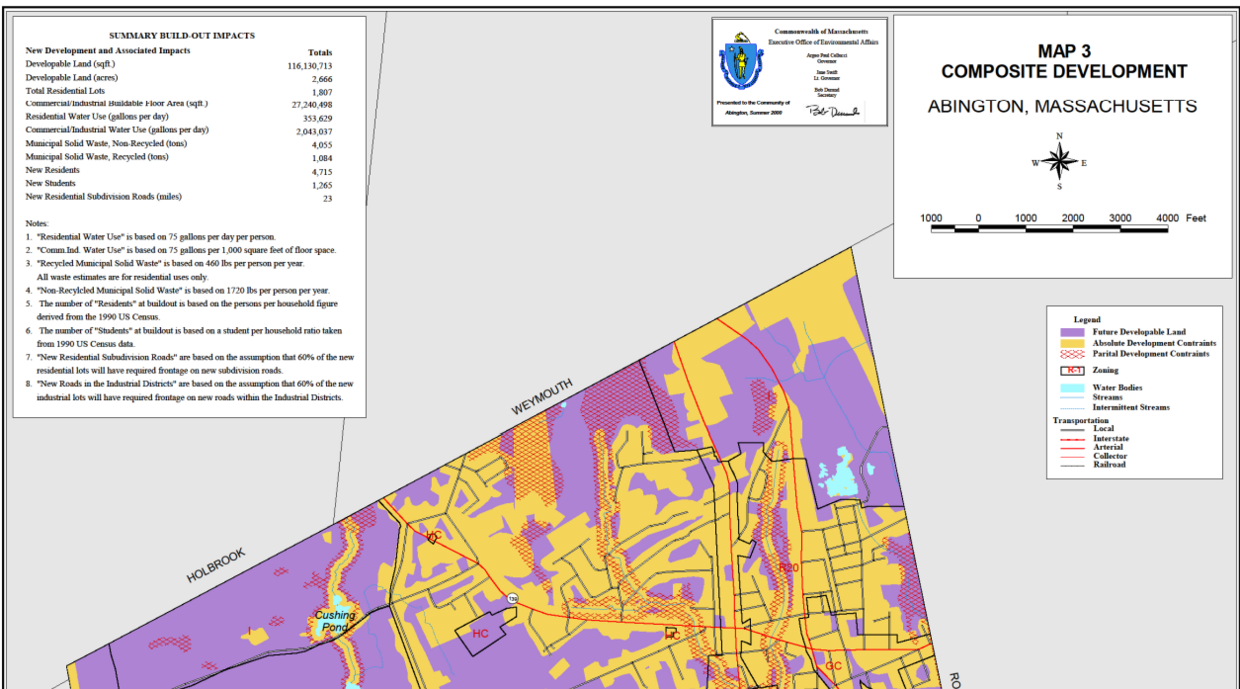
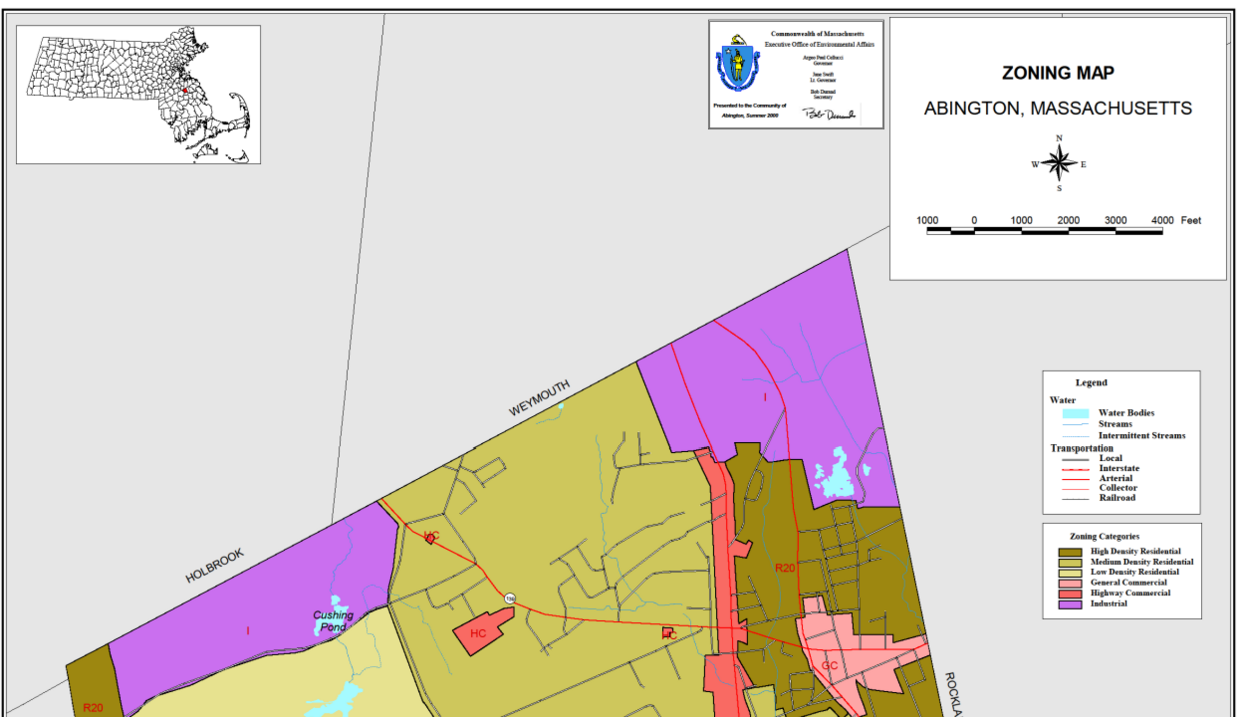
Buildout Mapping Project
Purpose: To support the passage of the Community Preservation Act
When: 1999-2001
Partners: Secretary of Environmental Affairs, Cities and Towns
Under the auspices Secretary of Environmental Affairs Robert Durand, MassGIS embarked on a multi-year project to produce a buildout analysis for every community in the Commonwealth. These analyses aggregated mapping of existing land use, zoning and other development constraints such as protected open space to show what potentially could be built in the long-term.
A series of four maps was provided to every community to help illustrate current conditions and then what the city or town might look like at buildout.
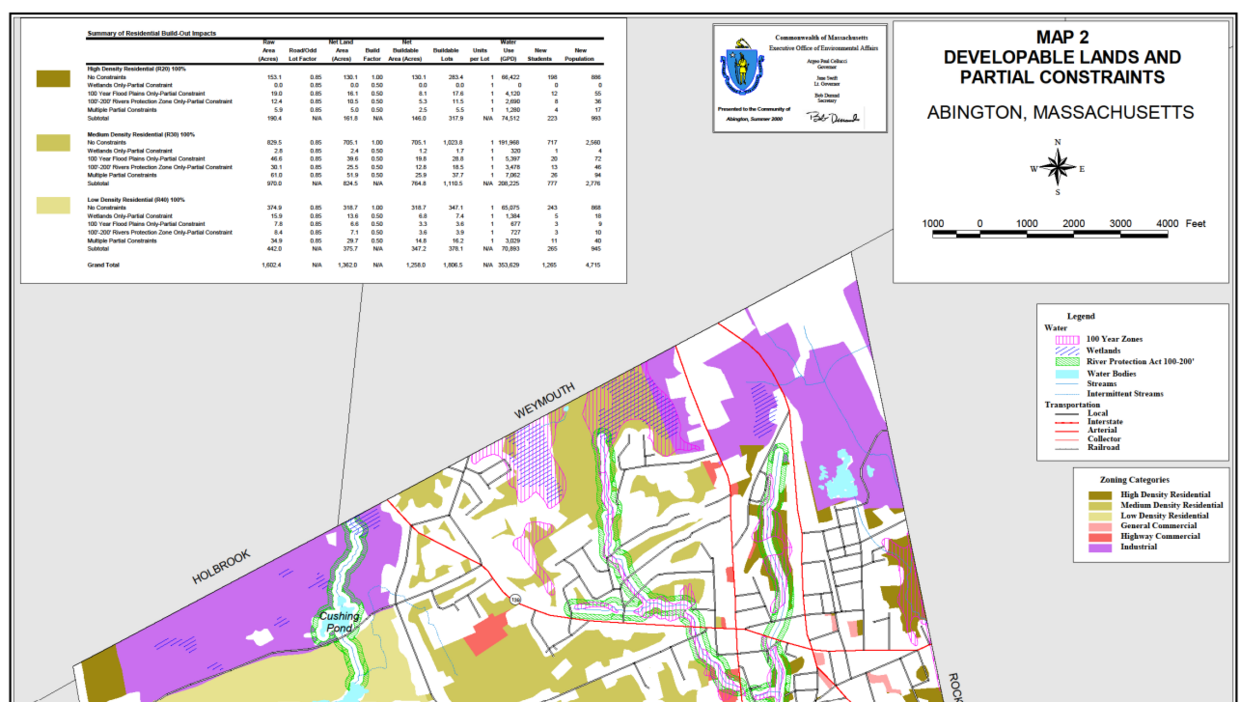
In recognition of the effort, MassGIS received an award from Digital Government Magazine in 2002.

Cape Cod Land Use Time Series
Created as part of the Buildout project, the maps in this time series show the dramatic effects of development on Cape Cod from 1951 to estimated buildout in the future.


